E-commerce feedback widget. Case Study
- Igor Alekseev
- Feb 21, 2019
- 3 min read
Most eCommerce stores aim at rapid growth. They can reach the goal either by growing their market share, or expanding their store size, or just gaining larger profit margins. But what if an e-commerce business has a personalized approach that can be applied to all commerce user segments?
We designed the critical approach on how to reach the e-commerce clients’ needs through base marketing channels and shifting our value proposition to them. The main idea was to create an online store widget that allows users to get feedback from market influences, bloggers, opinion leaders, and design the managing sales dashboard.
Moving on to our essential design process, we have done the base steps which can resolve the main e-commerce issues. Initially, we designed the Lean business model canvas, which allowed to understand the core business needs and define the main business marketing activities:

1. Most eCommerce stores aim at rapid growth. They can reach the goal either by growing their market share, or expanding their store size, or just gaining larger profit margins. But what if an e-commerce business has a personalized approach that can be applied to all commerce user segments?
2. We designed the critical approach on how to reach the e-commerce clients’ needs through base marketing channels and shifting our value proposition to them. The main idea was to create an online store widget that allows users to get feedback from market influences, bloggers, opinion leaders, and design the managing sales dashboard.
3. Moving on to our essential design process, we have done the base steps which can resolve the main e-commerce issues.
4. Initially, we designed the Lean business model canvas, which allowed to understand the core business needs and define the main business marketing activities.
Job-To-Be-Done canvas
After defining the core of user hypotheses we did a couple of quantity user researchers. It helps us to obtain plenty of jobs that we packed on “Jobs to be done” canvases. These canvases are intended to be a starting point to develop a hypothesis about a market of interest that can later be refined and validated through a more rigorous execution of the ODI process.
Here are the questions that we defined at the initial step to use this approach:
1. What group of customers to target for growth?
2. What job the customer is trying to get done?
3. Associated consumption, related and emotional jobs.
4. What are the customer’s desired outcomes (needs) associated with getting the core and consumption jobs done?
Here is one among the plenty of canvases that we have built on the primary hypotheses.

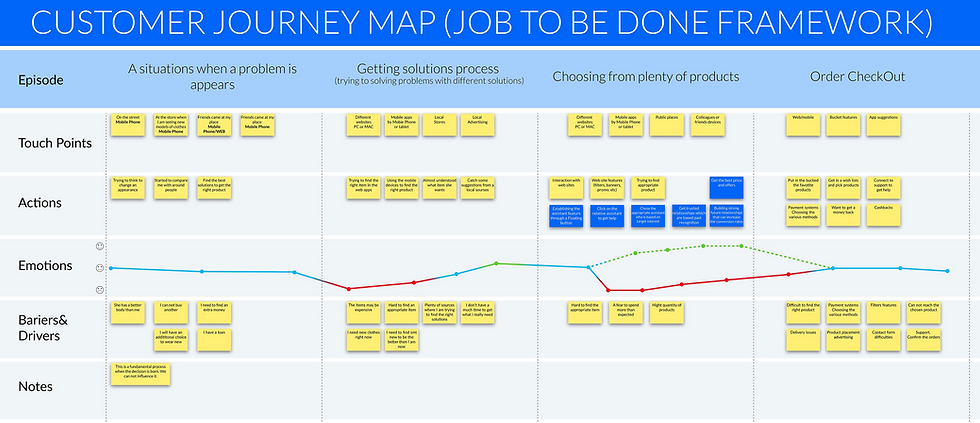
Customer journey mapping
After successively analyzing and validating Jobs To Be Done approaches, we go to customer journey mapping that helps us to define a kind of high-level overview you need to target customers with the content and touchpoints that will move them down your sales funnel.
After web analytics research, we got several KPI issues that need immediate attention:
1. No shopping activity — 56%. It indicated that there are problems with Product cards that must be resolved.
2. Cart abandonment rate — 89.8%. It is a critical issue that might be caused by payment concerns or broken user flow.
3. Check-Out abandonment — 93%. This issue appeared when users were in the credit card adding process. This issue also needs to be evaluated and fixed by improved user flow and a series of customer journey mapping.
We created a couple of user journeys that helped us to design a new user flow and implement the widget feature and finally decrease negative KPIs.

Furthermore, for the critical user behaviour stages, a couple of canvas blueprints were designed based on user quantitative interviews. It helped to implement better user flow mapping and cut the abandoned user flow path:

Implement Improvements
Once our map is complete, and we take all the insights and ideas, we start fixing all the weak spots you discovered and start drawing the first low fidelity prototypes. Occasionally, it seemed quite vague, and we were afraid that our crucial improvements would not reach a practical realization. But we continued to make efforts until we got an affordable result:

Later, we put the low and mid-fidelity wireframes together, and I created a live prototype on InVision and started plenty of live user testing. This is a critical step to validate our ideas and find the core user flow weakness. The research data that we collected from the usability testing showed whether users clicked it, and it helped us to get a heat map. Part of the users had problems understanding the main directions, but it cannot have a serious impact on user flows.
Finally, we started to create the final design and make a connection with developers. The result you can see below:


Comments